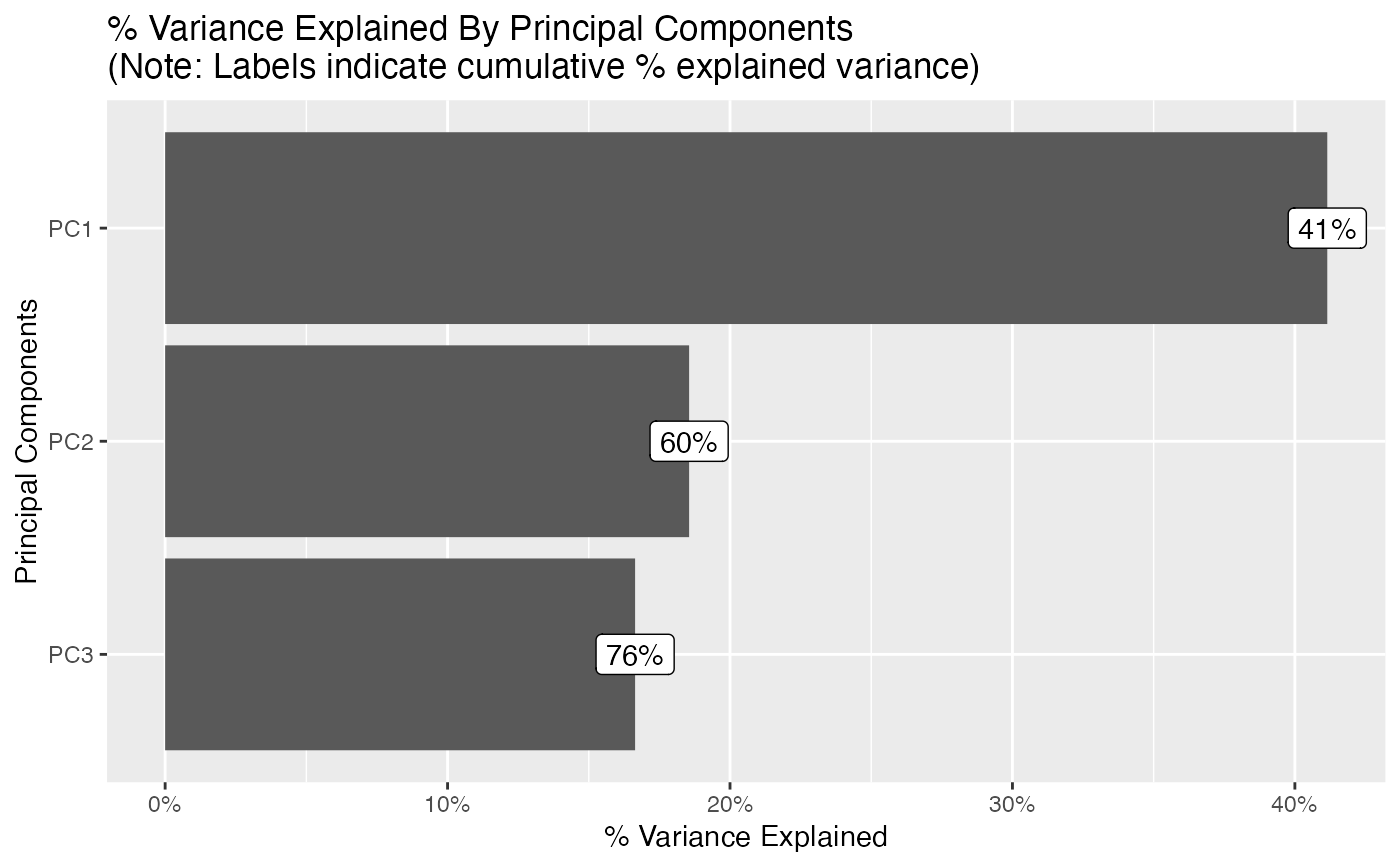
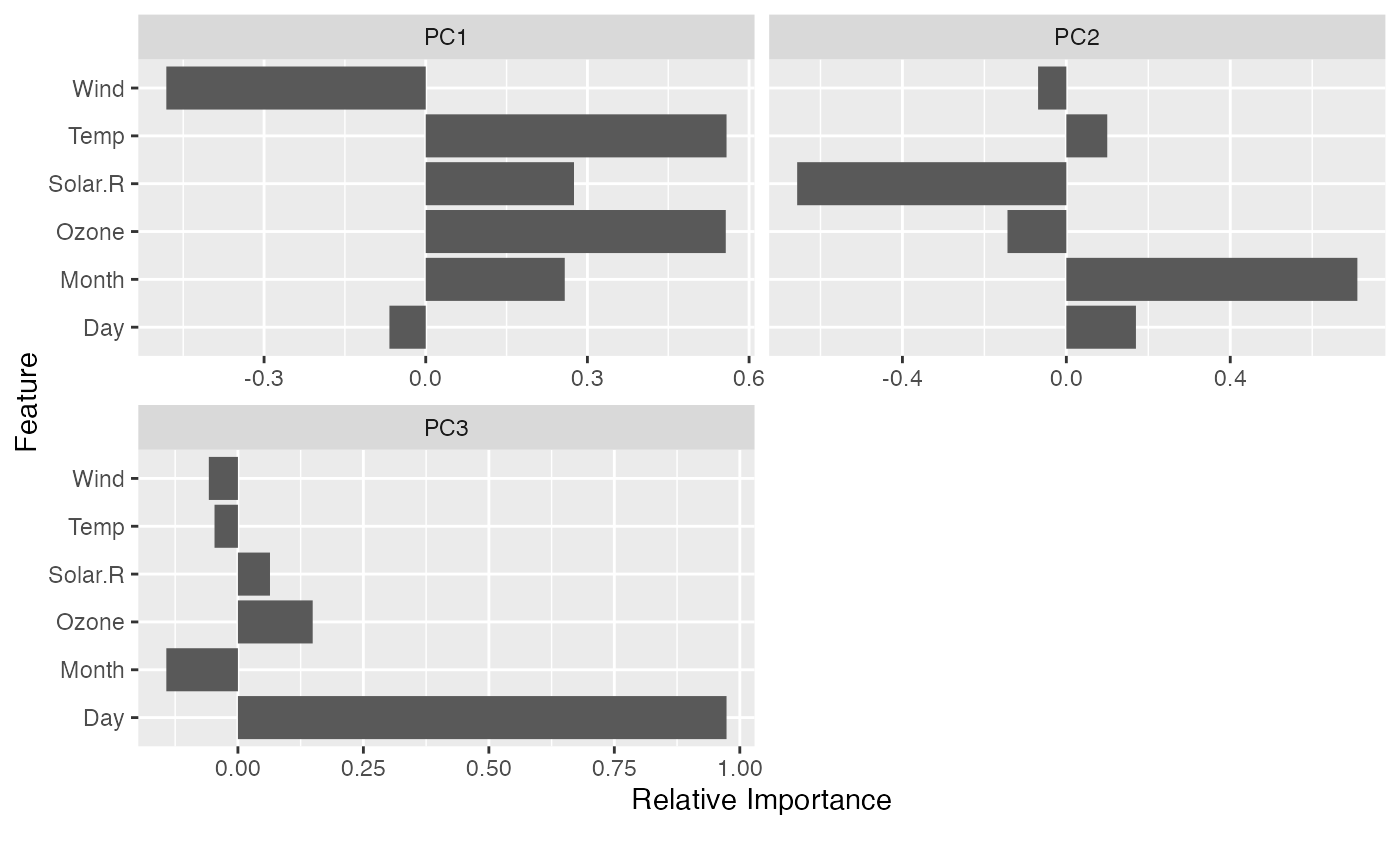
Visualize output of prcomp.
Usage
plot_prcomp(
  data,
  variance_cap = 0.8,
  maxcat = 50L,
  prcomp_args = list(scale. = TRUE),
  geom_label_args = list(),
  title = NULL,
  ggtheme = theme_gray(),
  theme_config = list(),
  nrow = 3L,
  ncol = 3L,
  parallel = FALSE,
  plotly = FALSE
)
Arguments
- data
input data
- variance_cap
maximum cumulative explained variance allowed for all principal components. Default is 80%.
- maxcat
maximum categories allowed for each discrete feature. The default is 50.
- prcomp_args
a list of other arguments to prcomp
- geom_label_args
a list of other arguments to geom_label
- title
plot title starting from page 2.
- ggtheme
complete ggplot2 themes. The default is theme_gray.
- theme_config
a list of configurations to be passed to theme.
- nrow
number of rows per page
- ncol
number of columns per page
- parallel
enable parallel? Default is
FALSE.- plotly
if
TRUE, convert to interactive plotly object (requires the plotly package). Default isFALSE.
Details
When cumulative explained variance exceeds variance_cap, remaining principal components will be ignored. Set variance_cap to 1 for all principal components.
Discrete features containing more categories than maxcat specifies will be ignored.
Note
Discrete features will be dummify-ed first before passing to prcomp.
Missing values may create issues in prcomp. Consider na.omit your input data first.
Features with zero variance are dropped.
Examples
plot_prcomp(na.omit(airquality), nrow = 2L, ncol = 2L)