This function creates boxplot for each continuous feature based on a selected feature.
Usage
plot_boxplot(
  data,
  by,
  binary_as_factor = TRUE,
  geom_boxplot_args = list(),
  geom_jitter_args = list(),
  scale_y = "continuous",
  title = NULL,
  ggtheme = theme_gray(),
  theme_config = list(),
  nrow = 3L,
  ncol = 4L,
  parallel = FALSE,
  plotly = FALSE
)
Arguments
- data
input data
- by
feature name to be broken down by. If selecting a continuous feature, boxplot will be grouped by 5 equal ranges, otherwise, all existing categories for a discrete feature.
- binary_as_factor
treat binary as categorical? Default is
TRUE.- geom_boxplot_args
a list of other arguments to geom_boxplot
- geom_jitter_args
a list of other arguments to geom_jitter. If empty, geom_jitter will not be added.
- scale_y
scale of original y axis (before
coord_flip). See scale_y_continuous for all options. Default iscontinuous.- title
plot title
- ggtheme
complete ggplot2 themes. The default is theme_gray.
- theme_config
a list of configurations to be passed to theme.
- nrow
number of rows per page
- ncol
number of columns per page
- parallel
enable parallel? Default is
FALSE.- plotly
if
TRUE, convert to interactive plotly object (requires the plotly package). Default isFALSE.
Examples
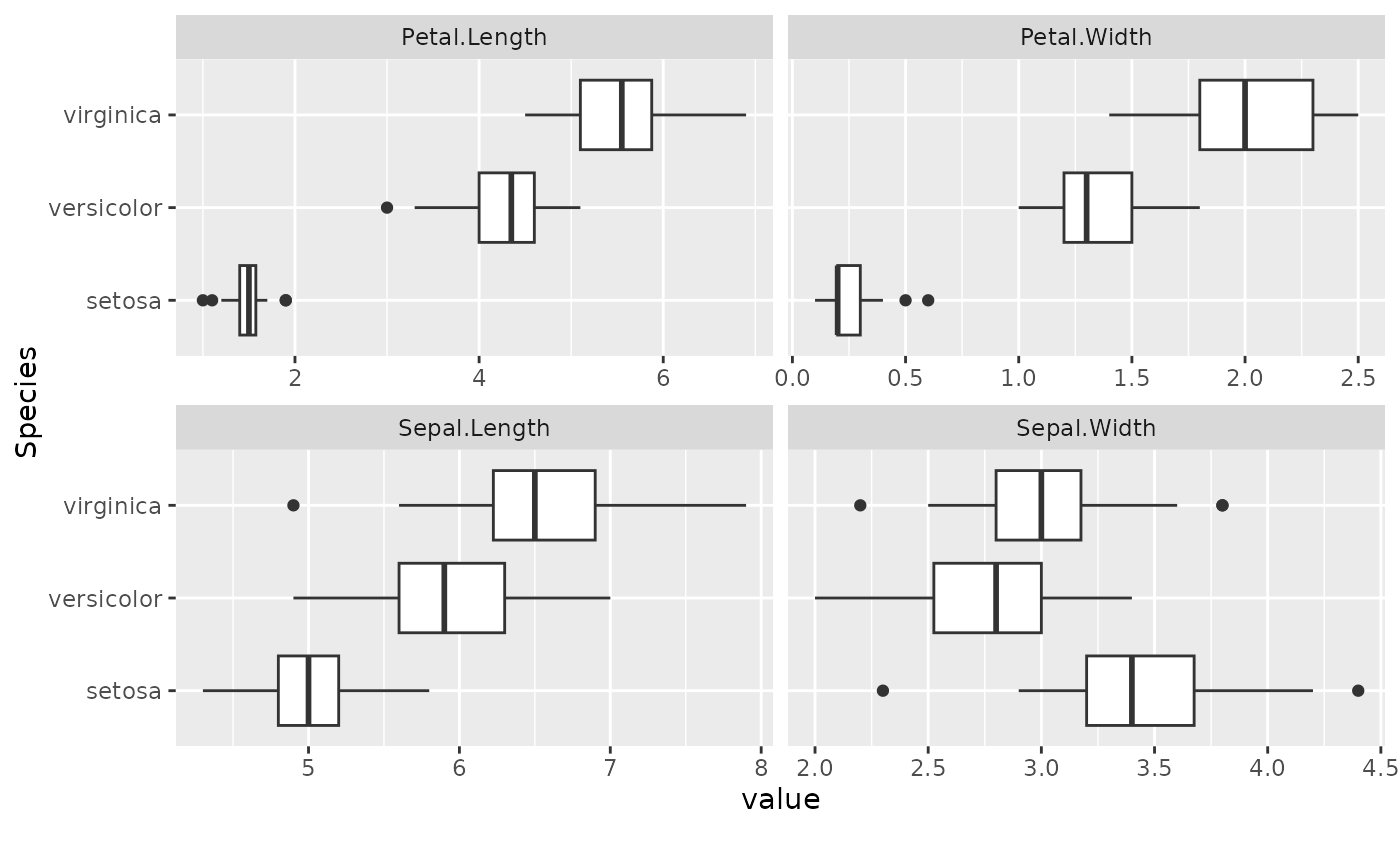
plot_boxplot(iris, by = "Species", ncol = 2L)
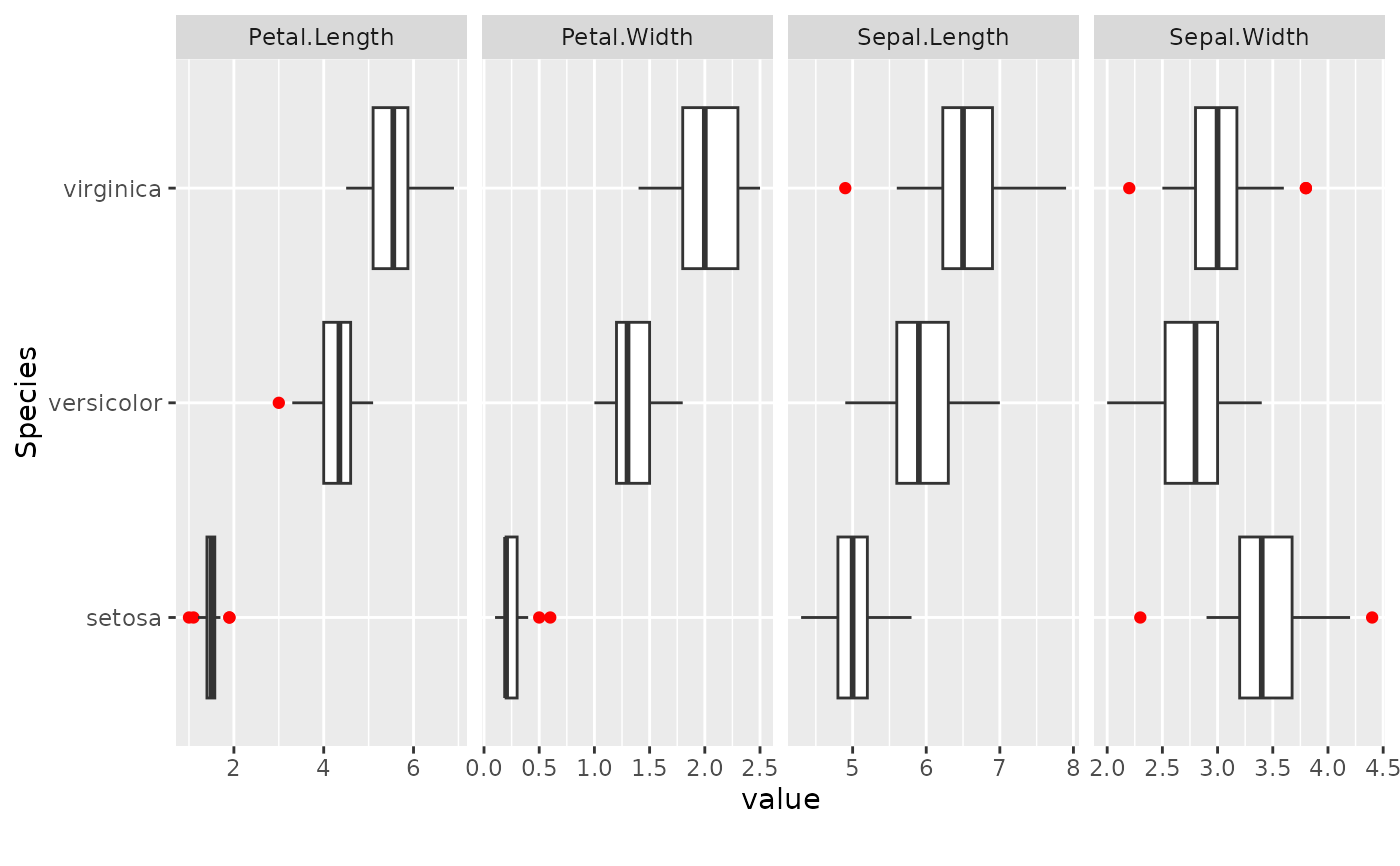
 plot_boxplot(iris, by = "Species", geom_boxplot_args = list("outlier.color" = "red"))
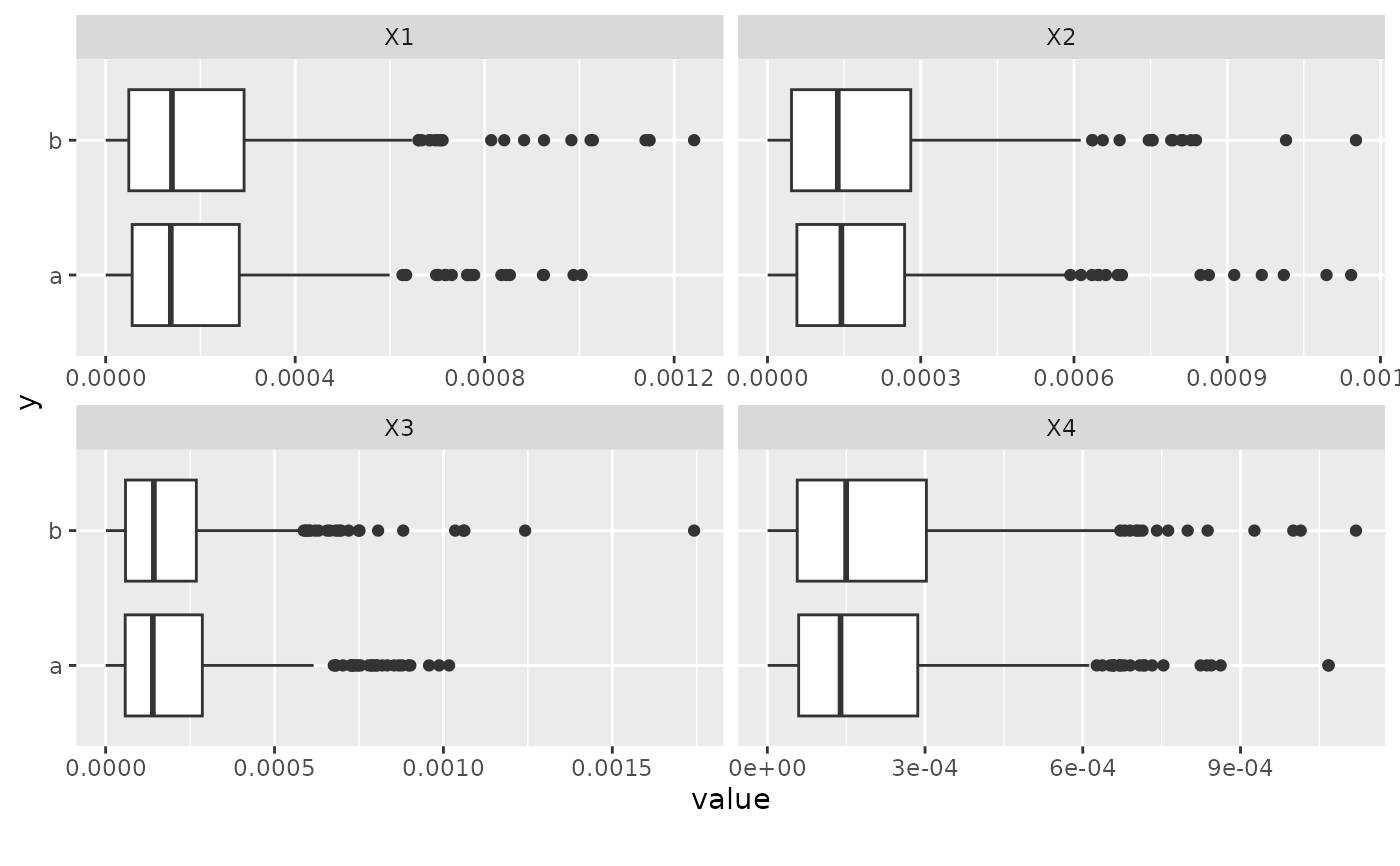
 # Plot skewed data on log scale
set.seed(1)
skew <- data.frame(y = rep(c("a", "b"), 500), replicate(4L, rbeta(1000, 1, 5000)))
plot_boxplot(skew, by = "y", ncol = 2L)
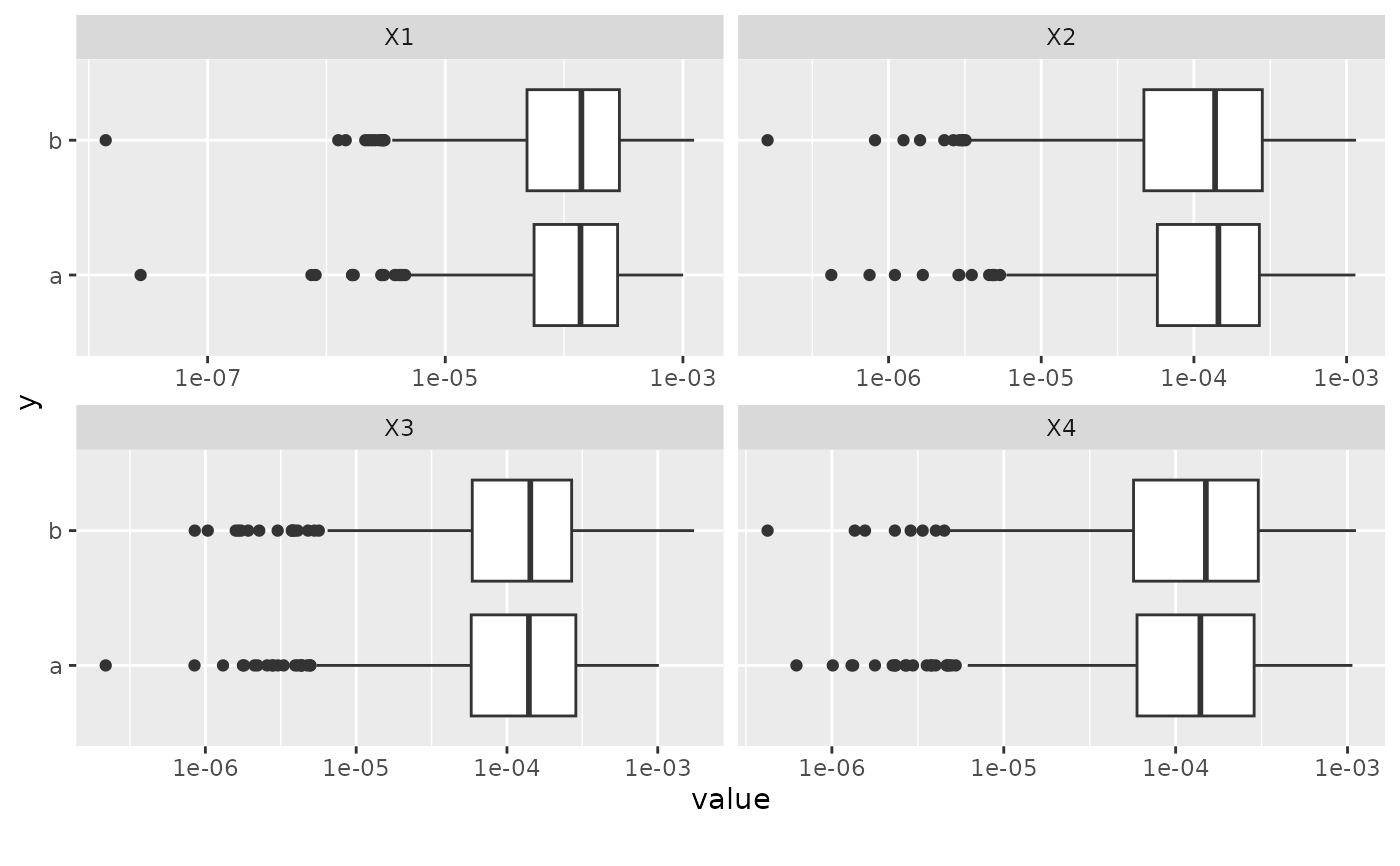
# Plot skewed data on log scale
set.seed(1)
skew <- data.frame(y = rep(c("a", "b"), 500), replicate(4L, rbeta(1000, 1, 5000)))
plot_boxplot(skew, by = "y", ncol = 2L)
 plot_boxplot(skew, by = "y", scale_y = "log10", ncol = 2L)
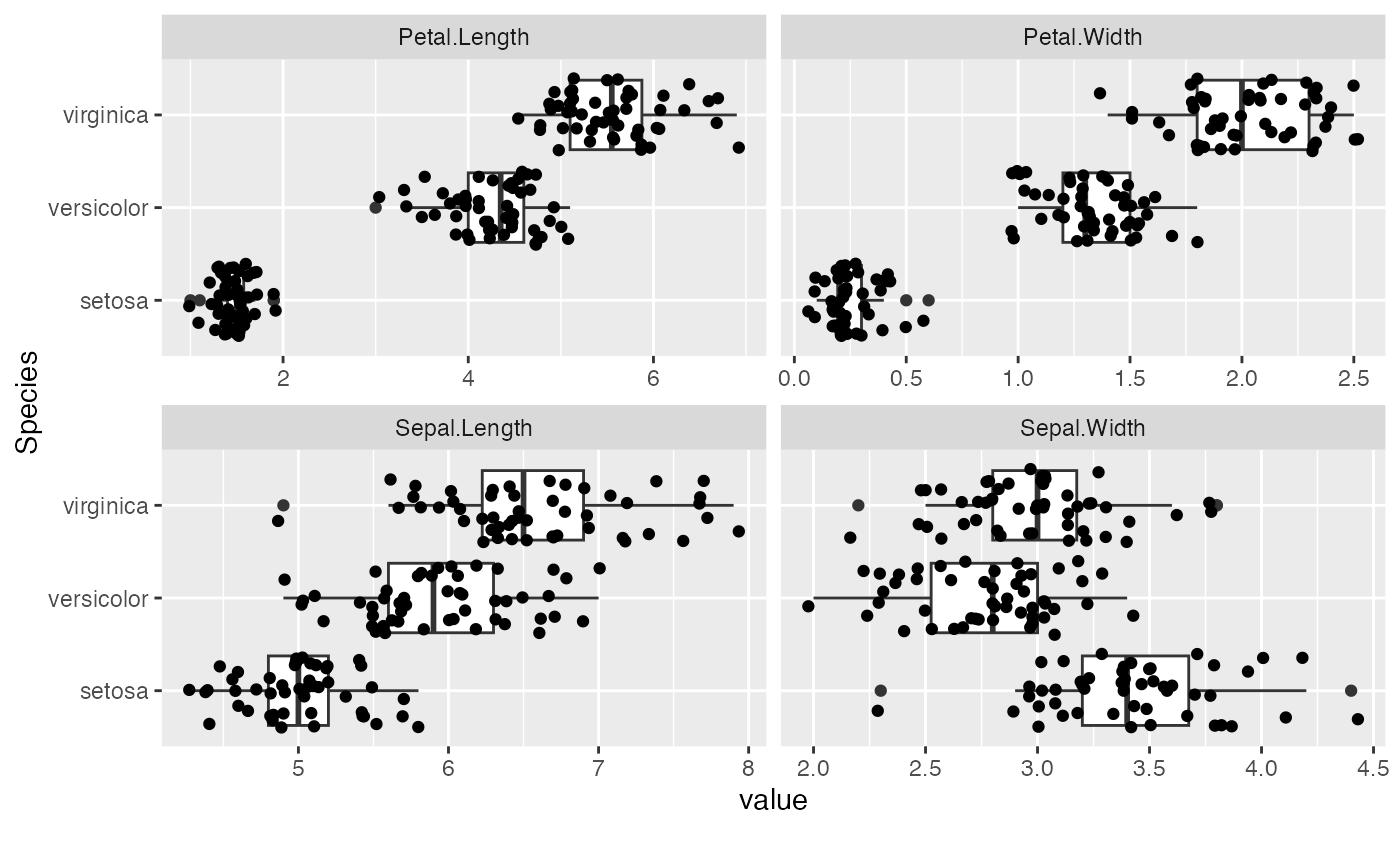
 # Plot with `geom_jitter`
plot_boxplot(iris, by = "Species", ncol = 2L,
geom_jitter_args = list(width = NULL)) # Turn on with default settings
# Plot with `geom_jitter`
plot_boxplot(iris, by = "Species", ncol = 2L,
geom_jitter_args = list(width = NULL)) # Turn on with default settings