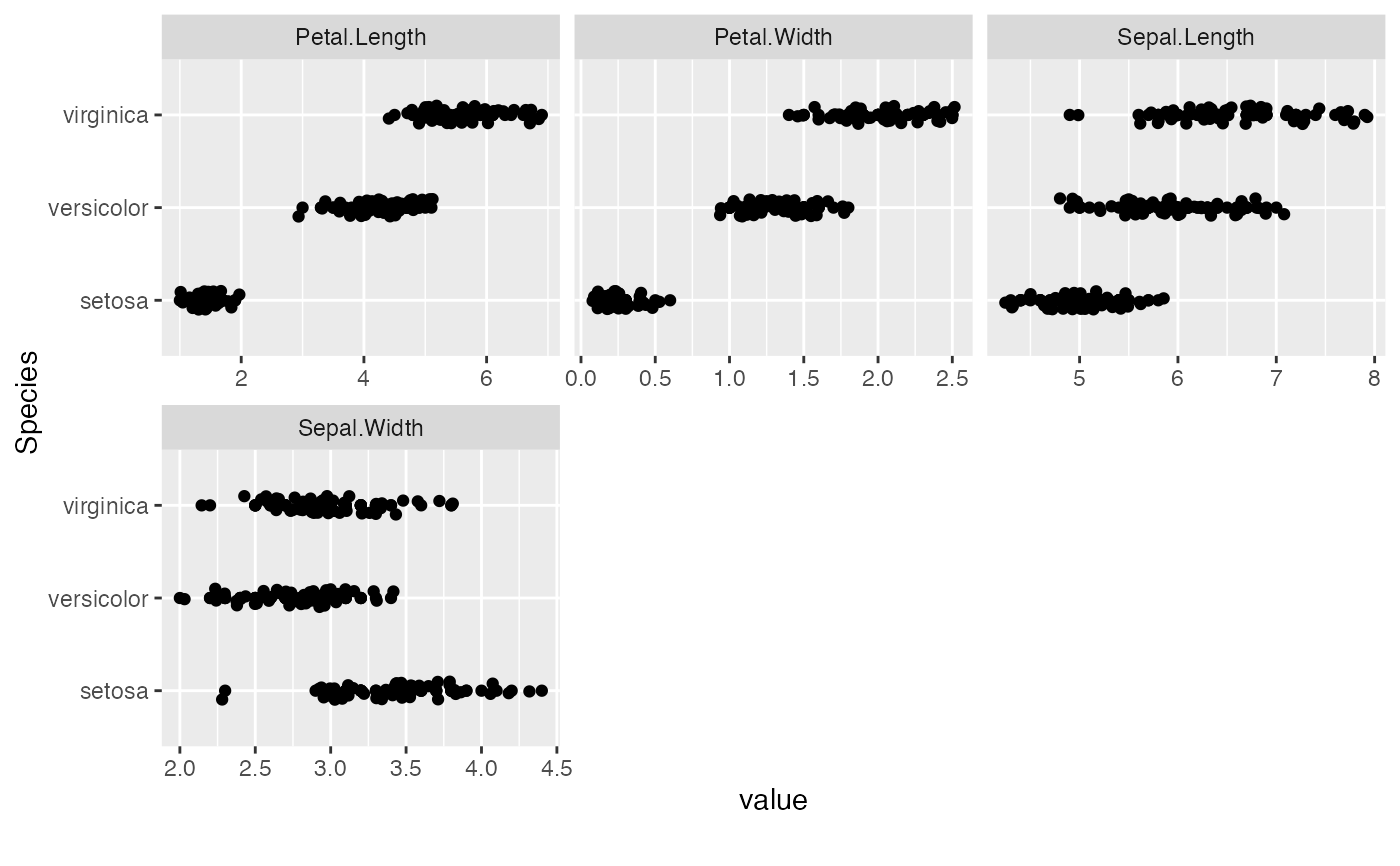
This function creates scatterplot for all features fixing on a selected feature.
Usage
plot_scatterplot(
  data,
  by,
  sampled_rows = nrow(data),
  geom_point_args = list(),
  geom_jitter_args = list(),
  scale_x = NULL,
  scale_y = NULL,
  title = NULL,
  ggtheme = theme_gray(),
  theme_config = list(),
  nrow = 3L,
  ncol = 3L,
  parallel = FALSE,
  plotly = FALSE
)
Arguments
- data
input data
- by
feature name to be fixed at
- sampled_rows
number of rows to sample if data has too many rows. Default is all rows, which means do not sample.
- geom_point_args
a list of other arguments to geom_point
- geom_jitter_args
a list of other arguments to geom_jitter. If empty, geom_jitter will not be added.
- scale_x
scale of original x axis (before
coord_flip). See scale_x_continuous for all options. Default isNULL.- scale_y
scale of original y axis (before
coord_flip). See scale_y_continuous for all options. Default isNULL.- title
plot title
- ggtheme
complete ggplot2 themes. The default is theme_gray.
- theme_config
a list of configurations to be passed to theme.
- nrow
number of rows per page
- ncol
number of columns per page
- parallel
enable parallel? Default is
FALSE.- plotly
if
TRUE, convert to interactive plotly object (requires the plotly package). Default isFALSE.
Examples
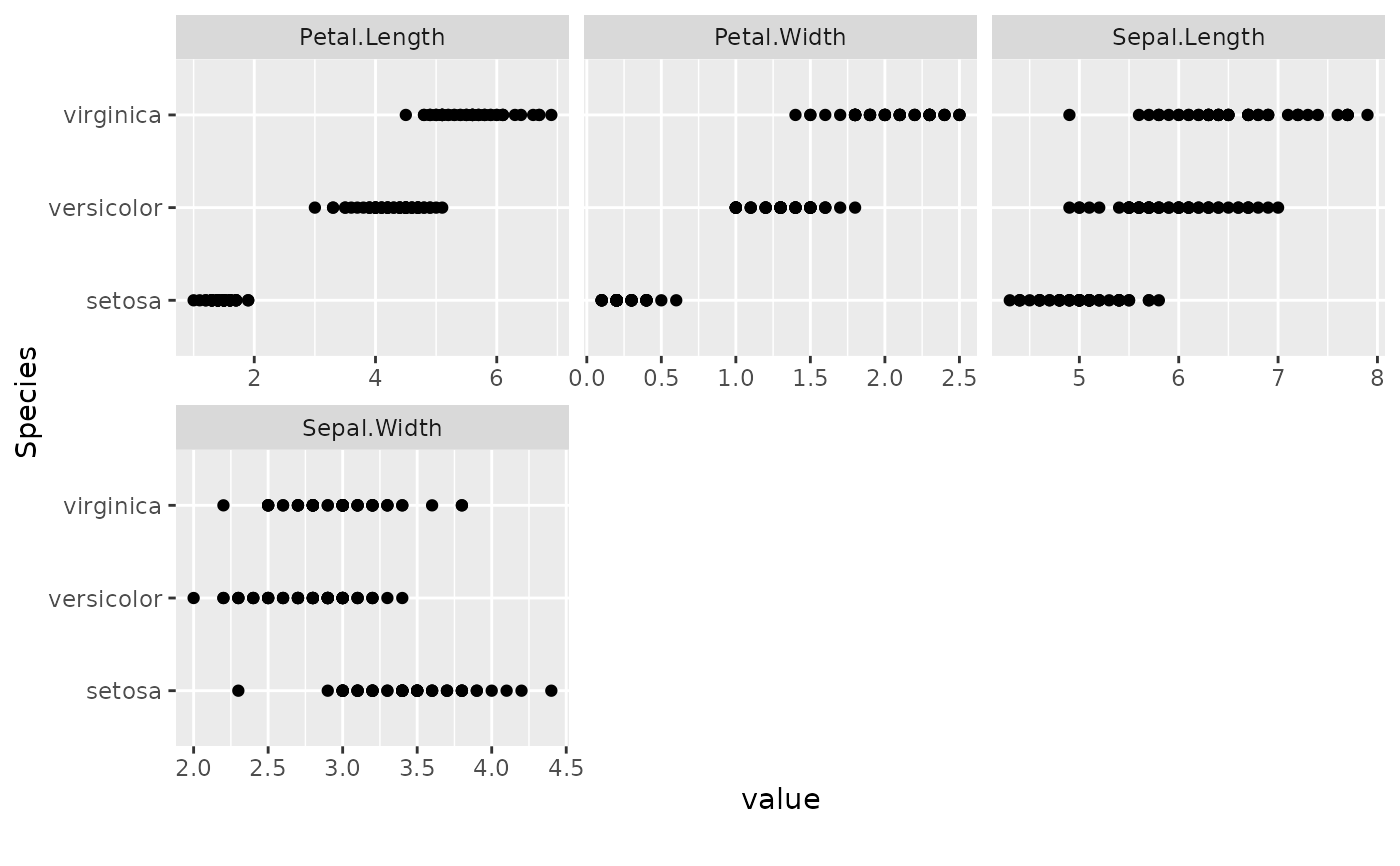
plot_scatterplot(iris, by = "Species")
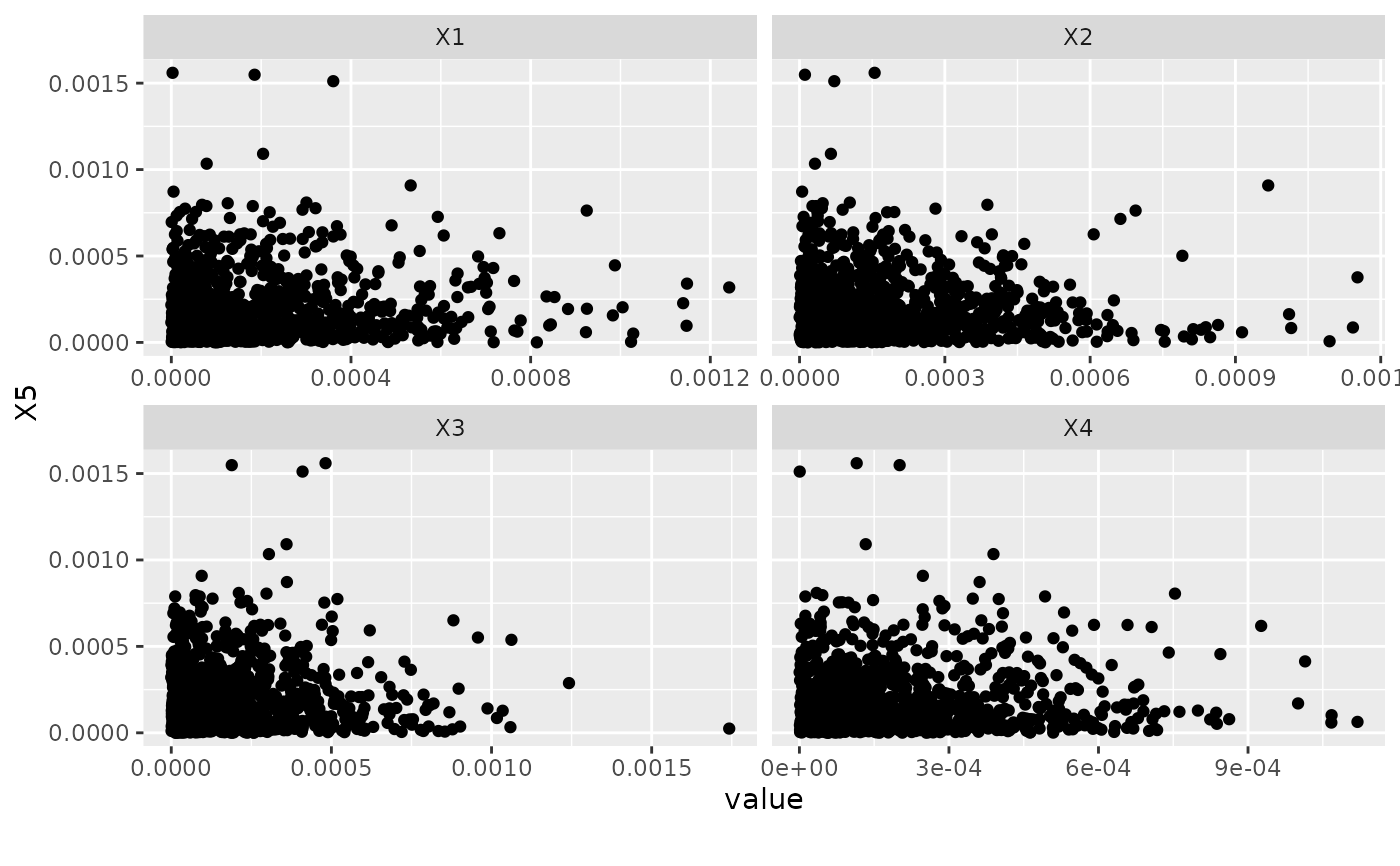
 # Plot skewed data on log scale
set.seed(1)
skew <- data.frame(replicate(5L, rbeta(1000, 1, 5000)))
plot_scatterplot(skew, by = "X5", ncol = 2L)
# Plot skewed data on log scale
set.seed(1)
skew <- data.frame(replicate(5L, rbeta(1000, 1, 5000)))
plot_scatterplot(skew, by = "X5", ncol = 2L)
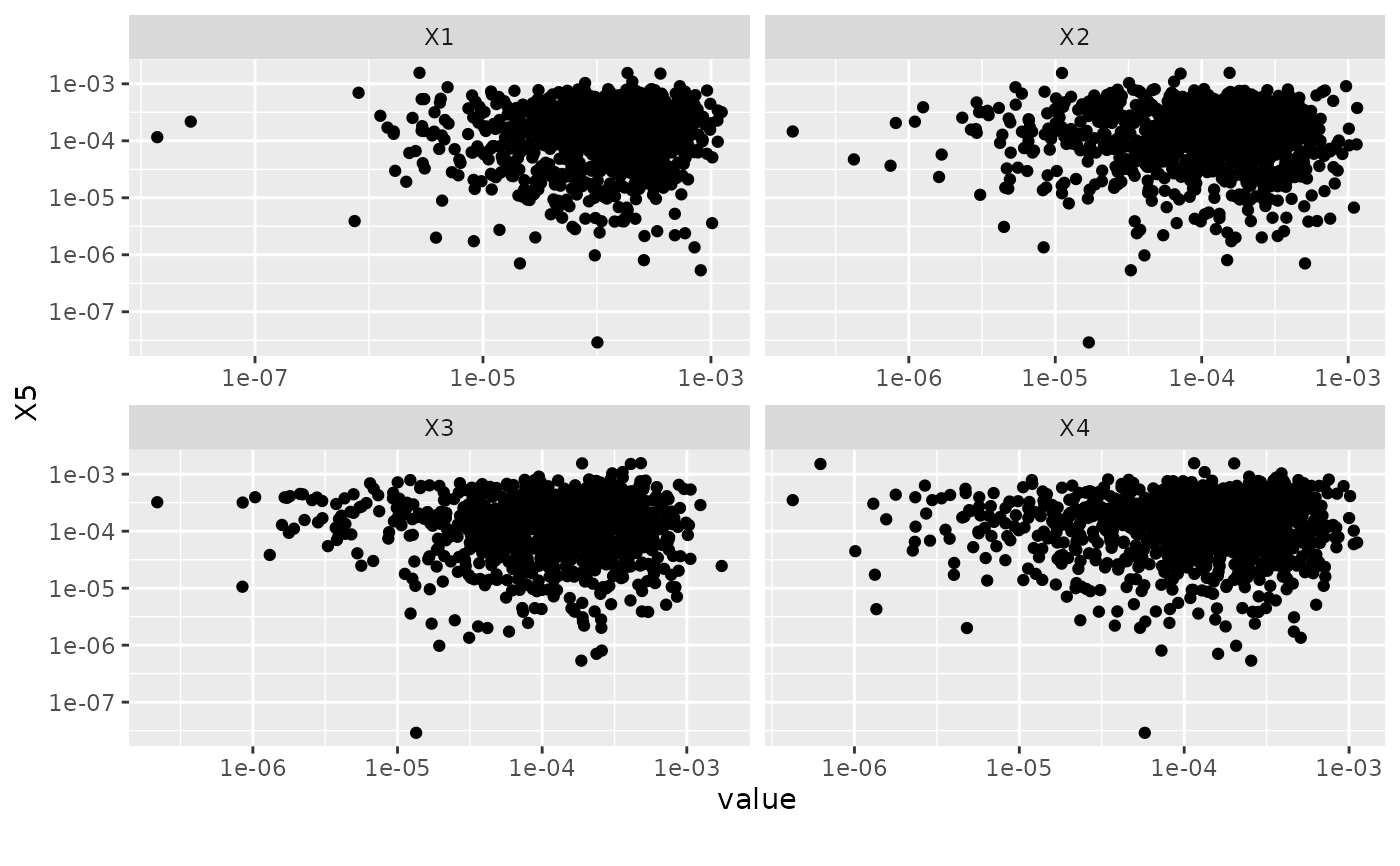
 plot_scatterplot(skew, by = "X5", scale_x = "log10",
scale_y = "log10", ncol = 2L)
plot_scatterplot(skew, by = "X5", scale_x = "log10",
scale_y = "log10", ncol = 2L)
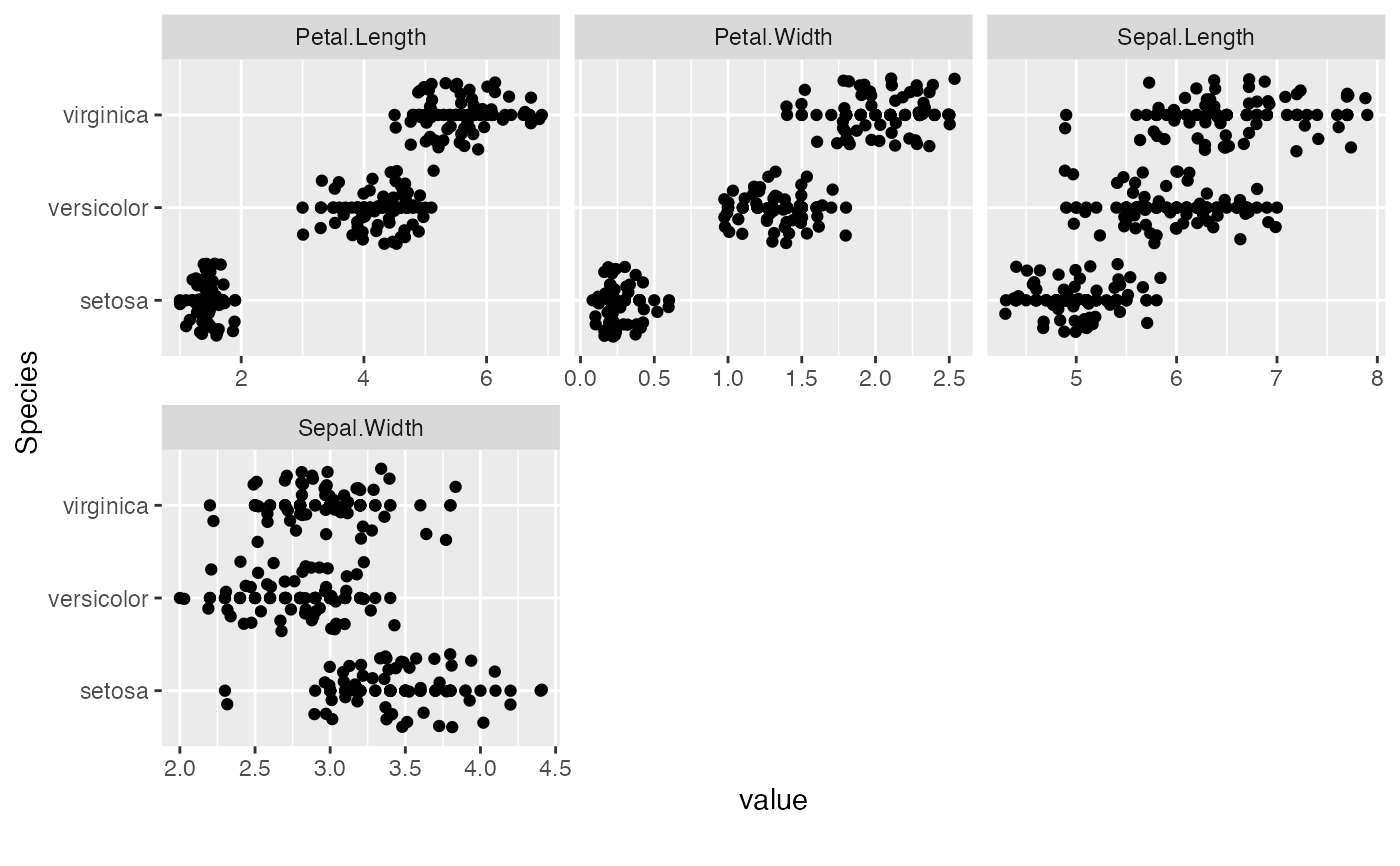
 # Plot with `geom_jitter`
plot_scatterplot(iris, by = "Species",
geom_jitter_args = list(width = NULL)) # Turn on with default settings
# Plot with `geom_jitter`
plot_scatterplot(iris, by = "Species",
geom_jitter_args = list(width = NULL)) # Turn on with default settings
 plot_scatterplot(iris, by = "Species",
geom_jitter_args = list(width = 0.1, height = 0.1))
plot_scatterplot(iris, by = "Species",
geom_jitter_args = list(width = 0.1, height = 0.1))
 if (FALSE) { # \dontrun{
# Customize themes
library(ggplot2)
plot_scatterplot(
data = mpg,
by = "hwy",
geom_point_args = list(size = 1L),
theme_config = list("axis.text.x" = element_text(angle = 90)),
ncol = 4L
)
} # }
if (FALSE) { # \dontrun{
# Customize themes
library(ggplot2)
plot_scatterplot(
data = mpg,
by = "hwy",
geom_point_args = list(size = 1L),
theme_config = list("axis.text.x" = element_text(angle = 90)),
ncol = 4L
)
} # }