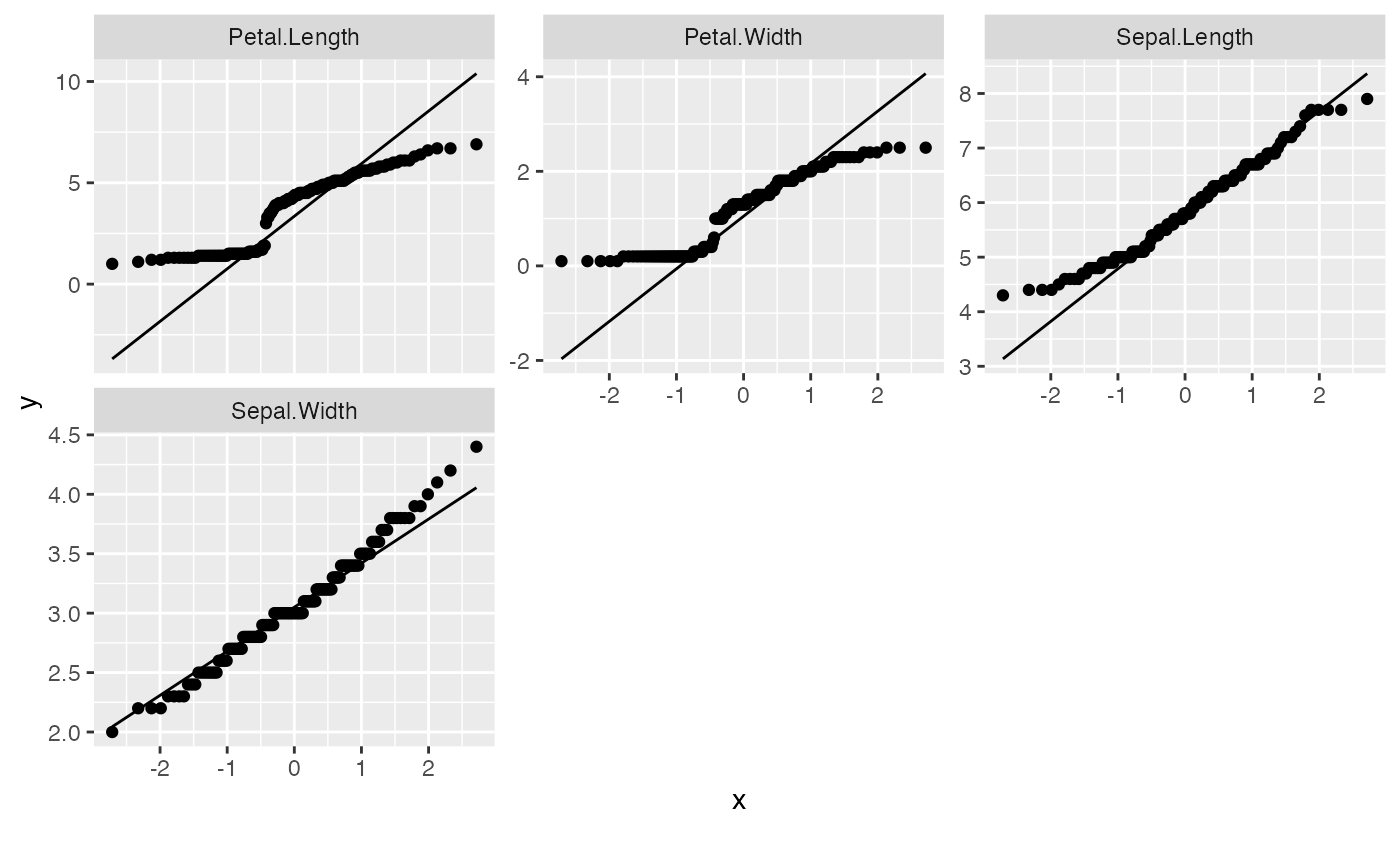
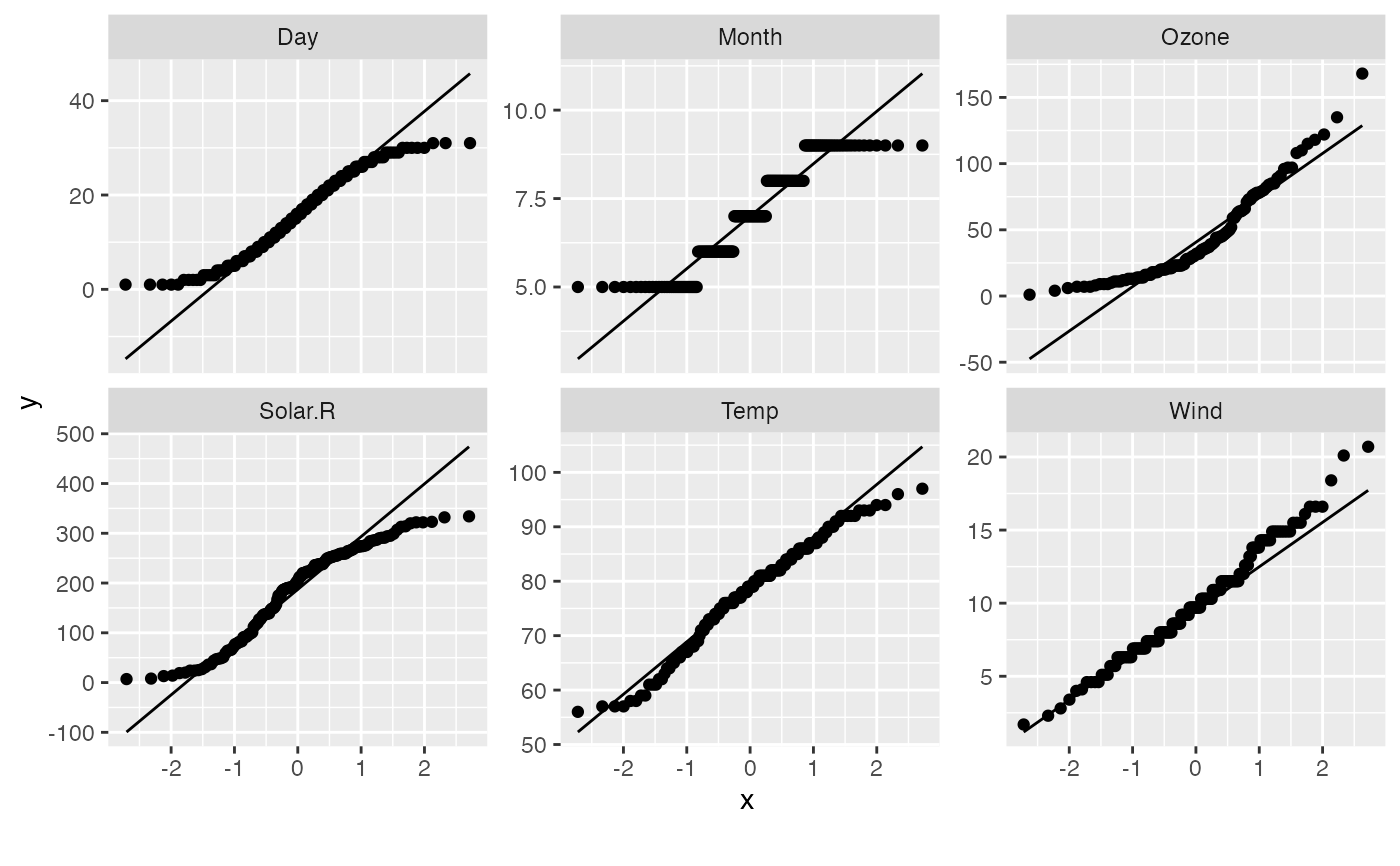
Plot quantile-quantile for each continuous feature
Usage
plot_qq(
  data,
  by = NULL,
  sampled_rows = nrow(data),
  geom_qq_args = list(),
  geom_qq_line_args = list(),
  title = NULL,
  ggtheme = theme_gray(),
  theme_config = list(),
  nrow = 3L,
  ncol = 3L,
  parallel = FALSE,
  plotly = FALSE
)
Arguments
- data
input data
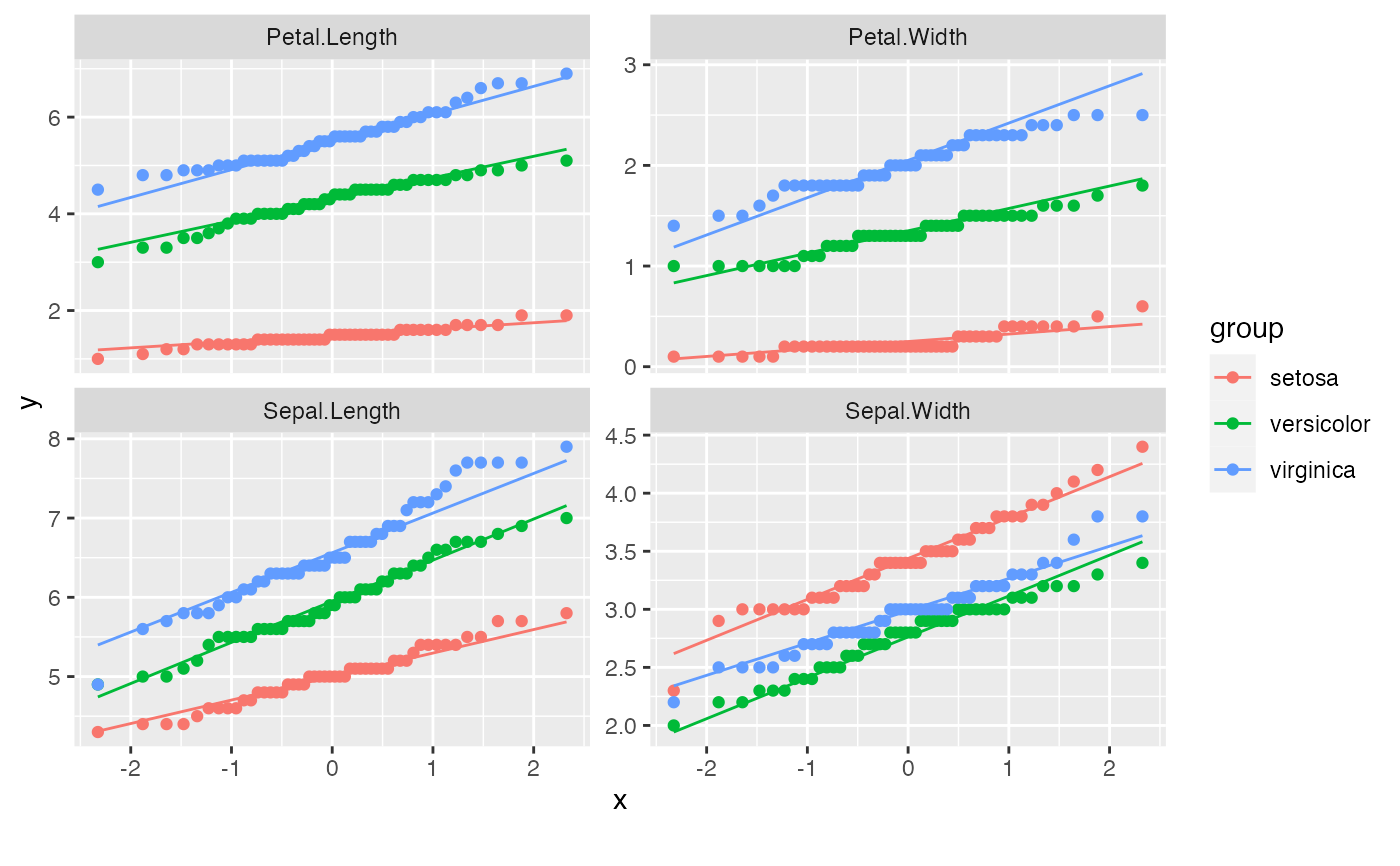
- by
feature name to be broken down by. If selecting a continuous feature, it will be grouped by 5 equal ranges, otherwise, all existing categories for a discrete feature. Default is
NULL.- sampled_rows
number of rows to sample if data has too many rows. Default is all rows, which means do not sample.
- geom_qq_args
a list of other arguments to geom_qq
- geom_qq_line_args
a list of other arguments to geom_qq_line
- title
plot title
- ggtheme
complete ggplot2 themes. Default is theme_gray.
- theme_config
a list of configurations to be passed to theme
- nrow
number of rows per page. Default is 3.
- ncol
number of columns per page. Default is 3.
- parallel
enable parallel? Default is
FALSE.- plotly
if
TRUE, convert to interactive plotly object (requires the plotly package). Default isFALSE.