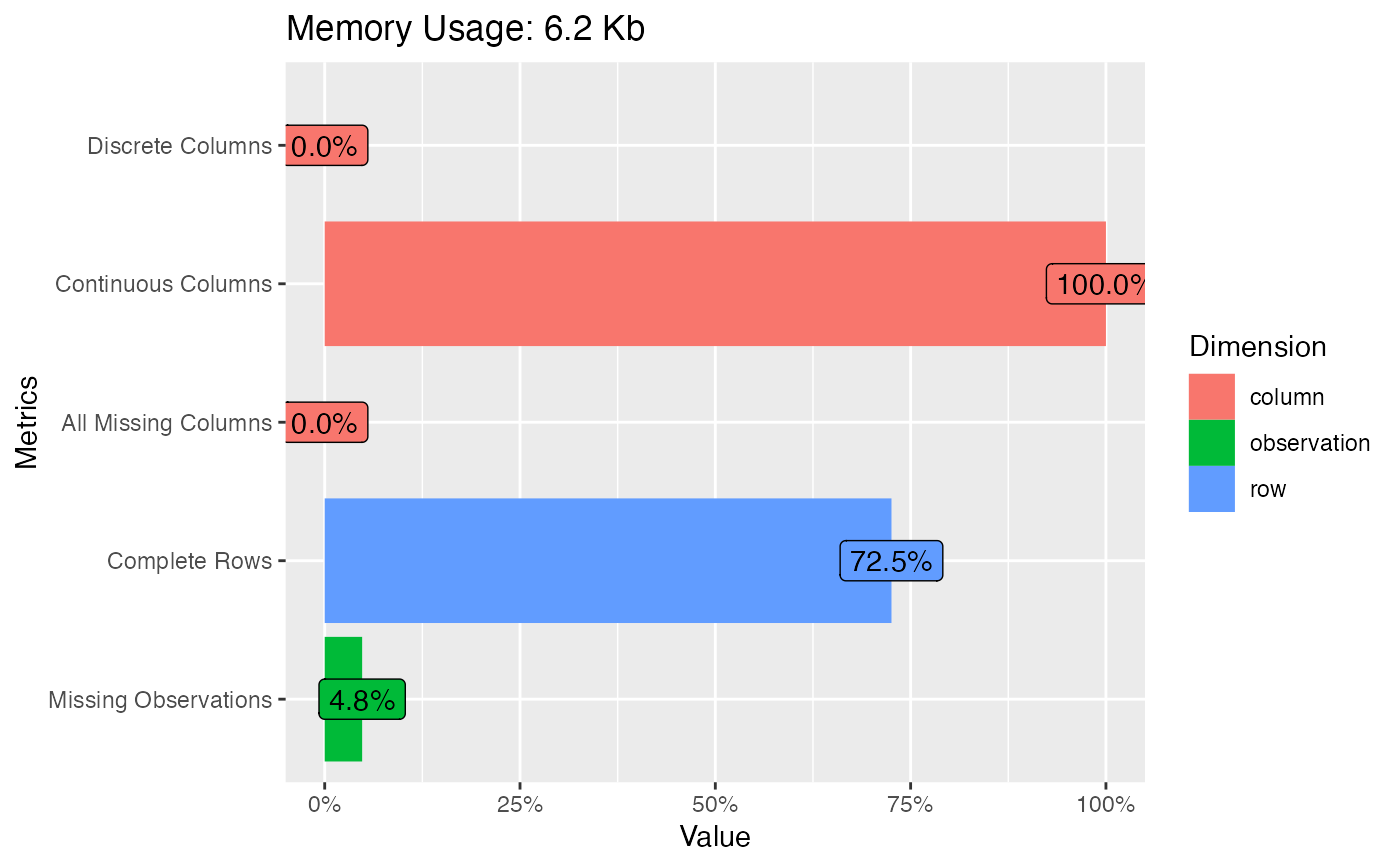
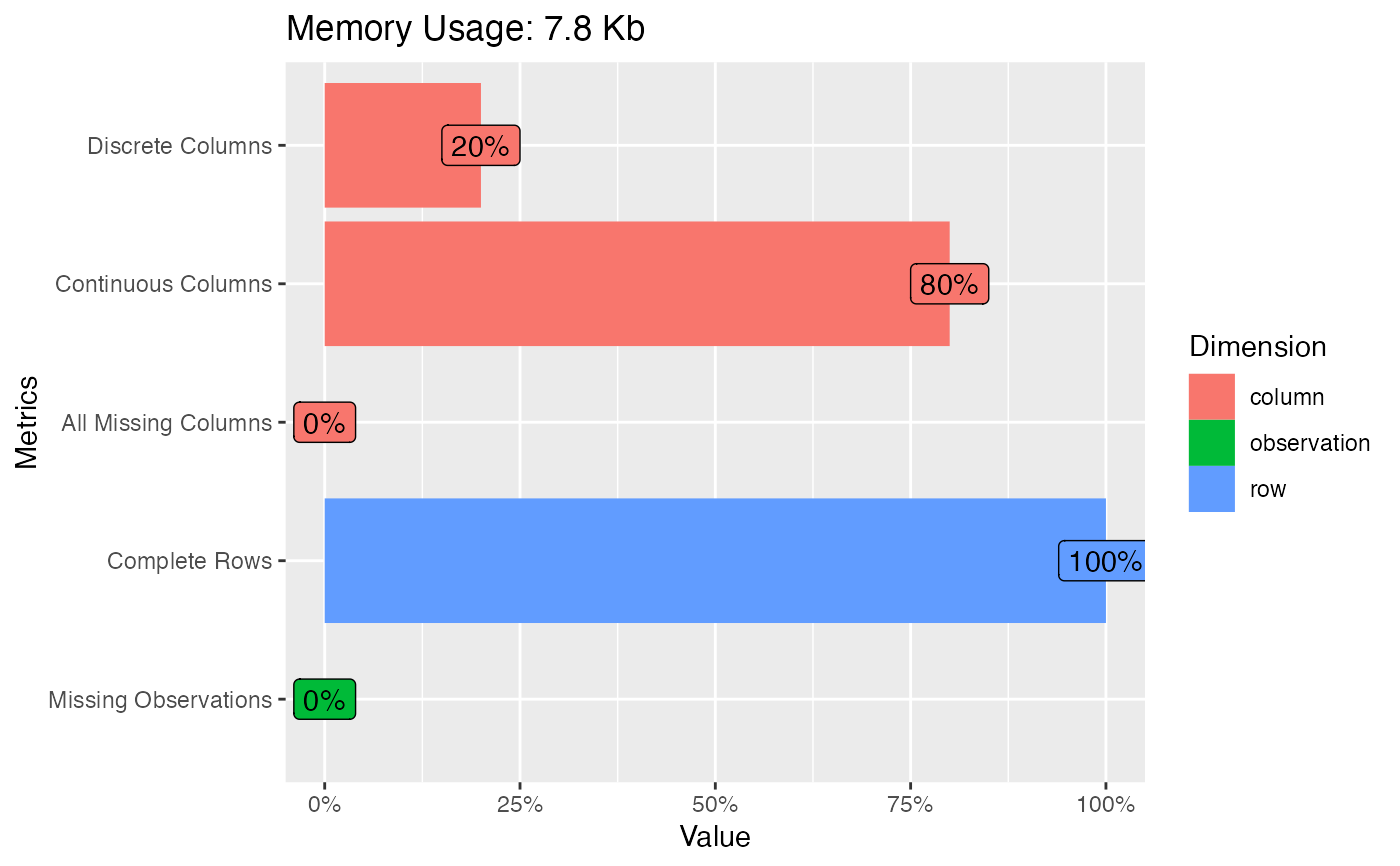
Plot basic information (from introduce) for input data.
Usage
plot_intro(
  data,
  geom_label_args = list(),
  title = NULL,
  ggtheme = theme_gray(),
  theme_config = list(),
  plotly = FALSE
)
Arguments
- data
input data
- geom_label_args
a list of other arguments to geom_label
- title
plot title
- ggtheme
complete ggplot2 themes. The default is theme_gray.
- theme_config
a list of configurations to be passed to theme.
- plotly
if
TRUE, convert to interactive plotly object (requires the plotly package). Default isFALSE.