Plot density estimates for each continuous feature
Usage
plot_density(
  data,
  by = NULL,
  binary_as_factor = TRUE,
  geom_density_args = list(),
  scale_x = "continuous",
  title = NULL,
  ggtheme = theme_gray(),
  theme_config = list(),
  nrow = 4L,
  ncol = 4L,
  parallel = FALSE,
  plotly = FALSE
)
Arguments
- data
input data
- by
feature name to be broken down by. If
NULL, no grouping. If a continuous feature, values are grouped into 5 equal ranges; otherwise all categories of a discrete feature are used.- binary_as_factor
treat binary as categorical? Default is
TRUE.- geom_density_args
a list of other arguments to geom_density
- scale_x
scale of x axis. See scale_x_continuous for all options. Default is
continuous.- title
plot title
- ggtheme
complete ggplot2 themes. The default is theme_gray.
- theme_config
a list of configurations to be passed to theme.
- nrow
number of rows per page. Default is 4.
- ncol
number of columns per page. Default is 4.
- parallel
enable parallel? Default is
FALSE.- plotly
if
TRUE, convert to interactive plotly object (requires the plotly package). Default isFALSE.
Examples
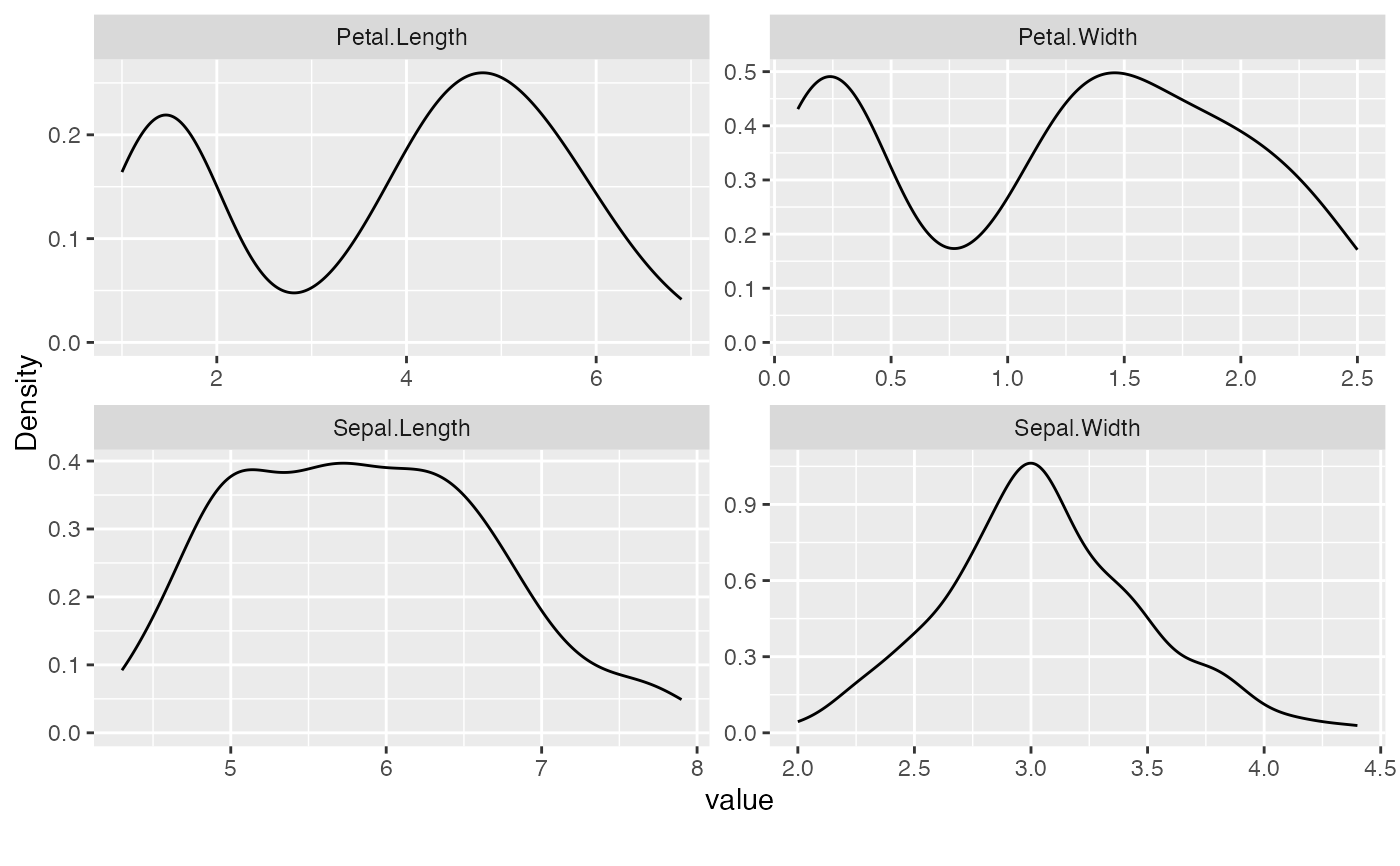
# Plot iris data
plot_density(iris, ncol = 2L)
 # Plot density by a discrete feature
plot_density(iris, by = "Species", ncol = 2L)
# Plot density by a discrete feature
plot_density(iris, by = "Species", ncol = 2L)
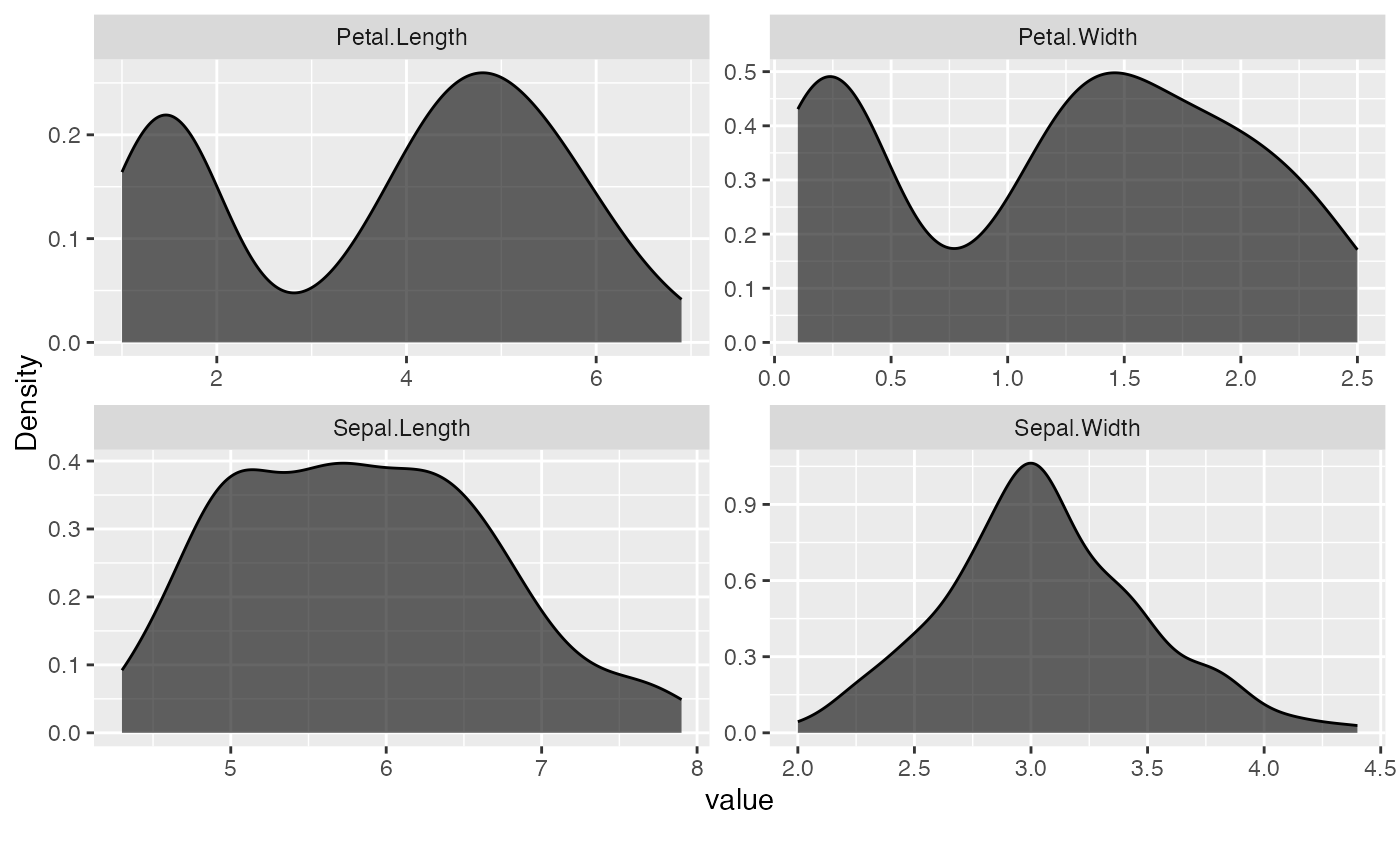 # Add color to density area
plot_density(iris, geom_density_args = list("fill" = "black", "alpha" = 0.6), ncol = 2L)
# Add color to density area
plot_density(iris, geom_density_args = list("fill" = "black", "alpha" = 0.6), ncol = 2L)
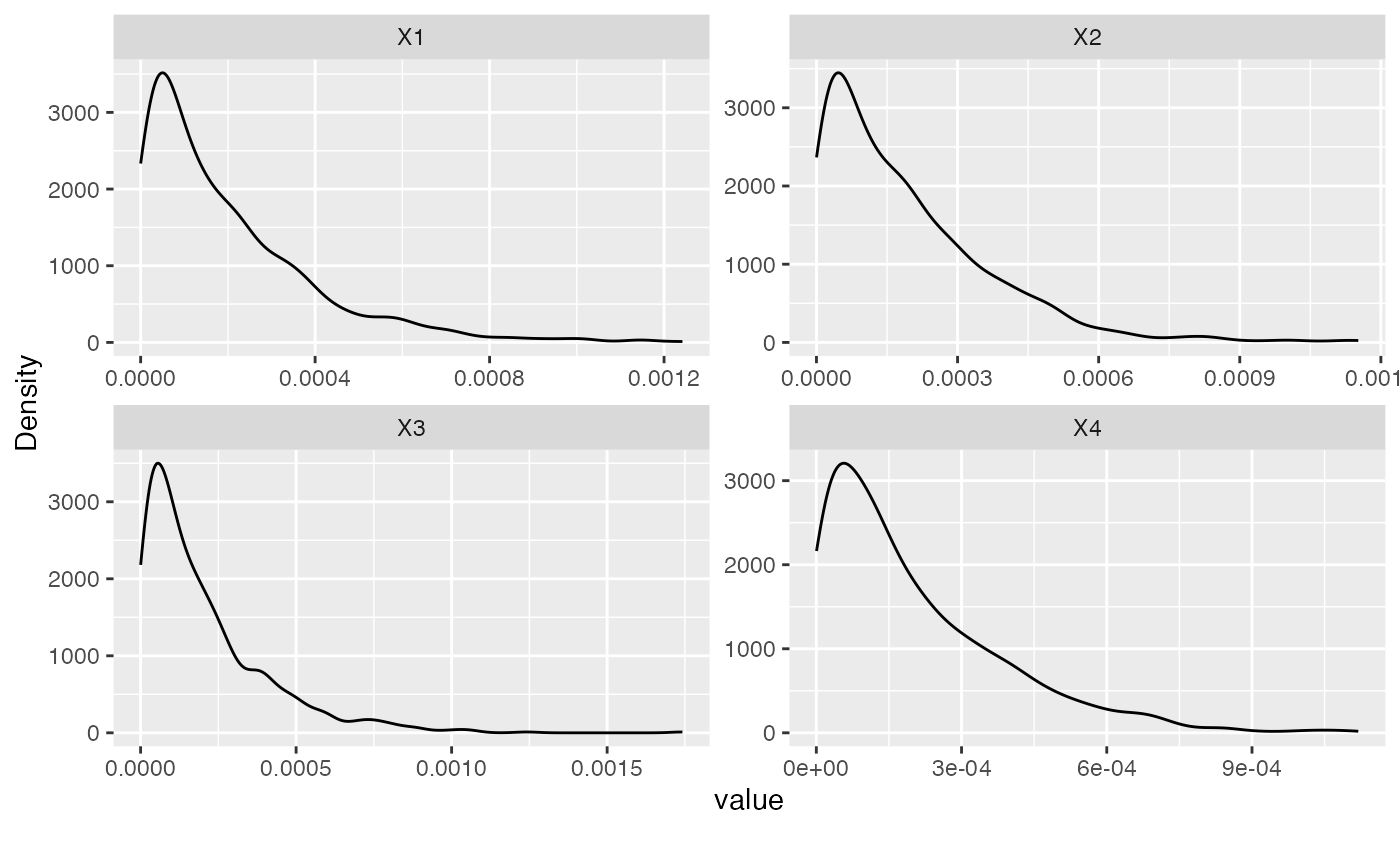 # Plot skewed data on log scale
set.seed(1)
skew <- data.frame(replicate(4L, rbeta(1000, 1, 5000)))
plot_density(skew, ncol = 2L)
# Plot skewed data on log scale
set.seed(1)
skew <- data.frame(replicate(4L, rbeta(1000, 1, 5000)))
plot_density(skew, ncol = 2L)
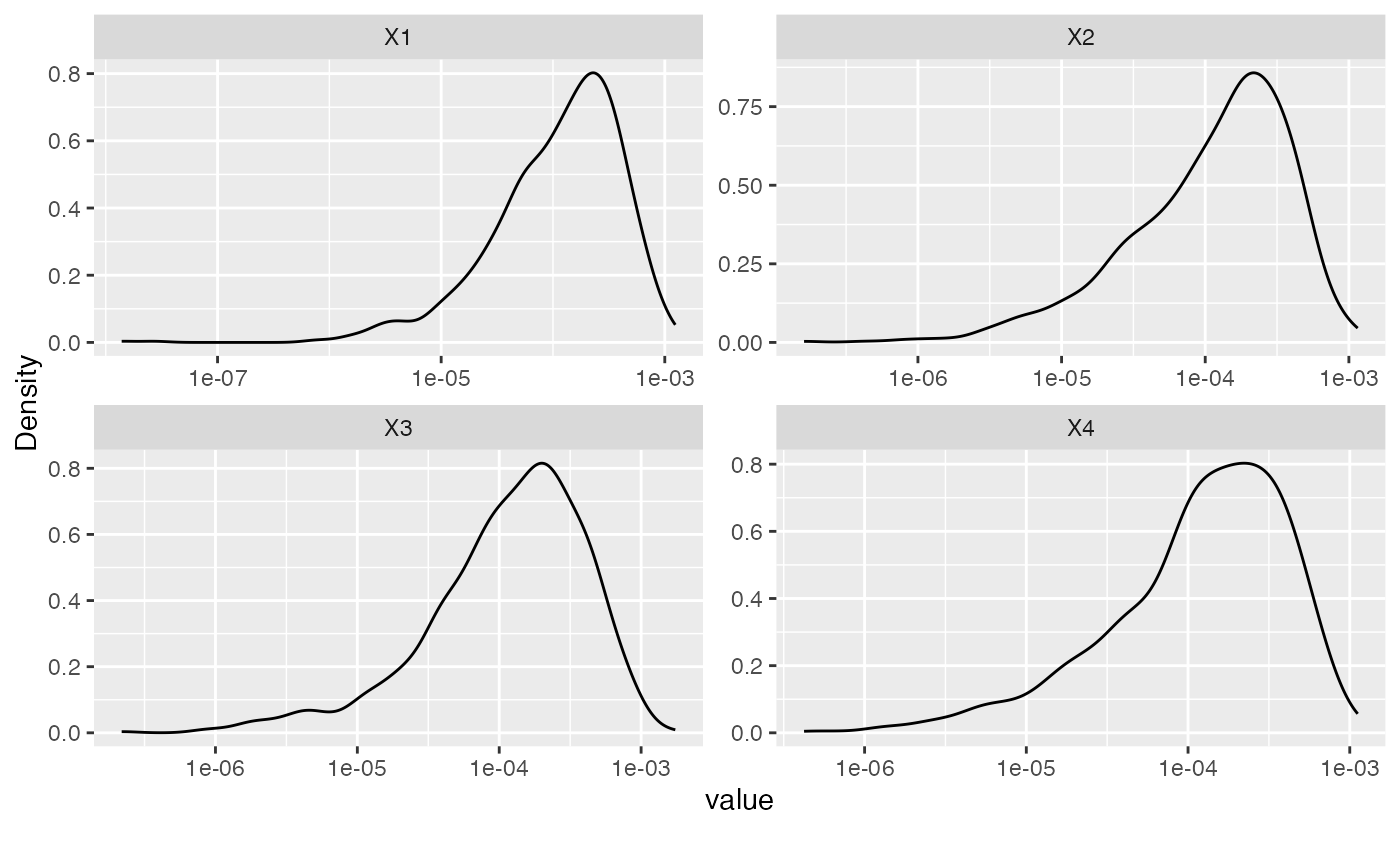 plot_density(skew, scale_x = "log10", ncol = 2L)
