This function creates a correlation heatmap for all discrete categories.
Usage
plot_correlation(
  data,
  type = c("all", "discrete", "continuous"),
  maxcat = 20L,
  cor_args = list(),
  geom_text_args = list(),
  title = NULL,
  ggtheme = theme_gray(),
  theme_config = list(legend.position = "bottom", axis.text.x = element_text(angle = 90)),
  plotly = FALSE
)
Arguments
- data
input data
- type
column type to be included in correlation calculation. "all" for all columns, "discrete" for discrete features, "continuous" for continuous features.
- maxcat
maximum categories allowed for each discrete feature. The default is 20.
- cor_args
a list of other arguments to cor
- geom_text_args
a list of other arguments to geom_text
- title
plot title
- ggtheme
complete ggplot2 themes. The default is theme_gray.
- theme_config
a list of configurations to be passed to theme.
- plotly
if
TRUE, convert to interactive plotly object (requires the plotly package). Default isFALSE.
Details
For discrete features, the function first dummifies all categories, then calculates the correlation matrix (see cor) and plots it.
Examples
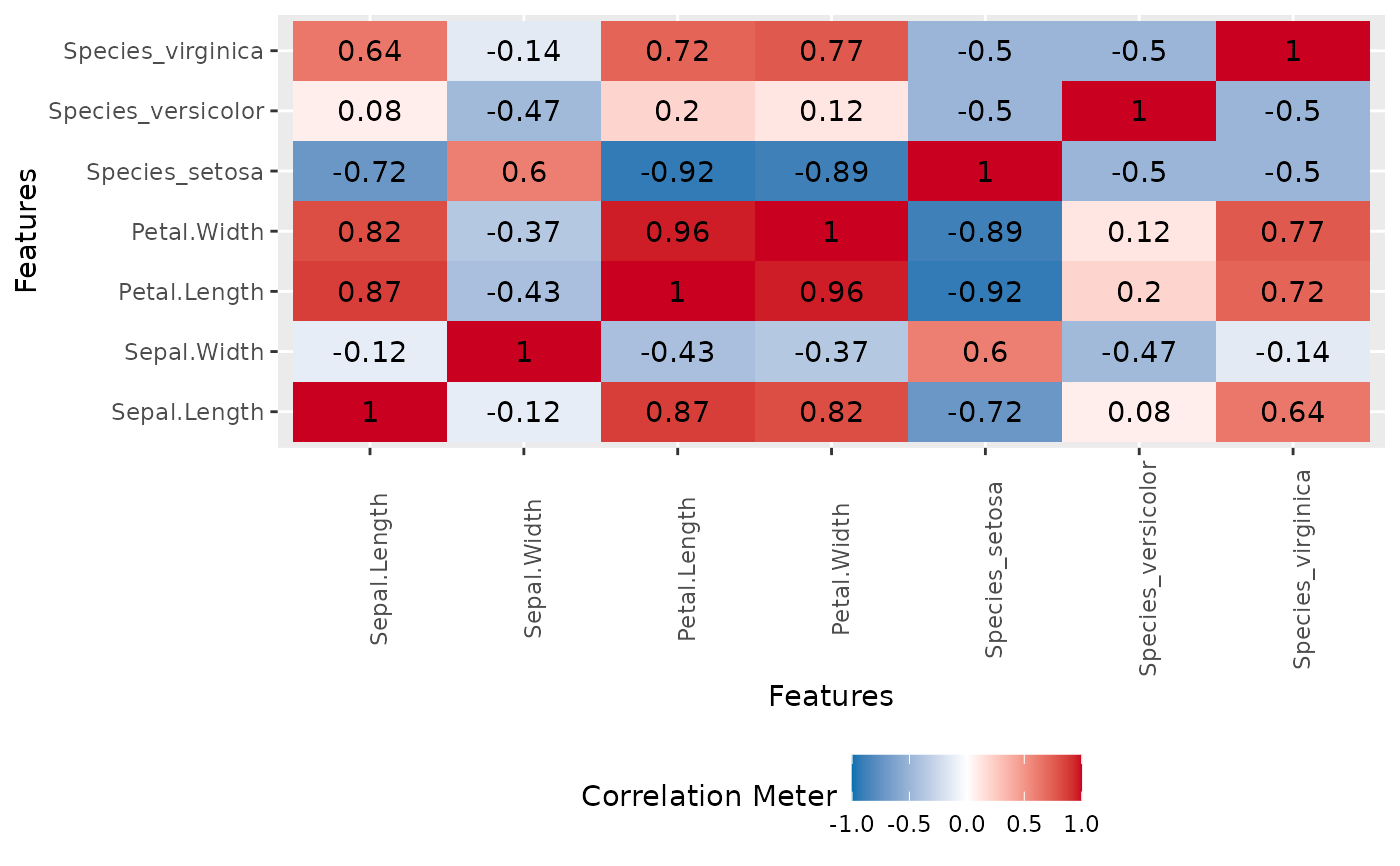
plot_correlation(iris)
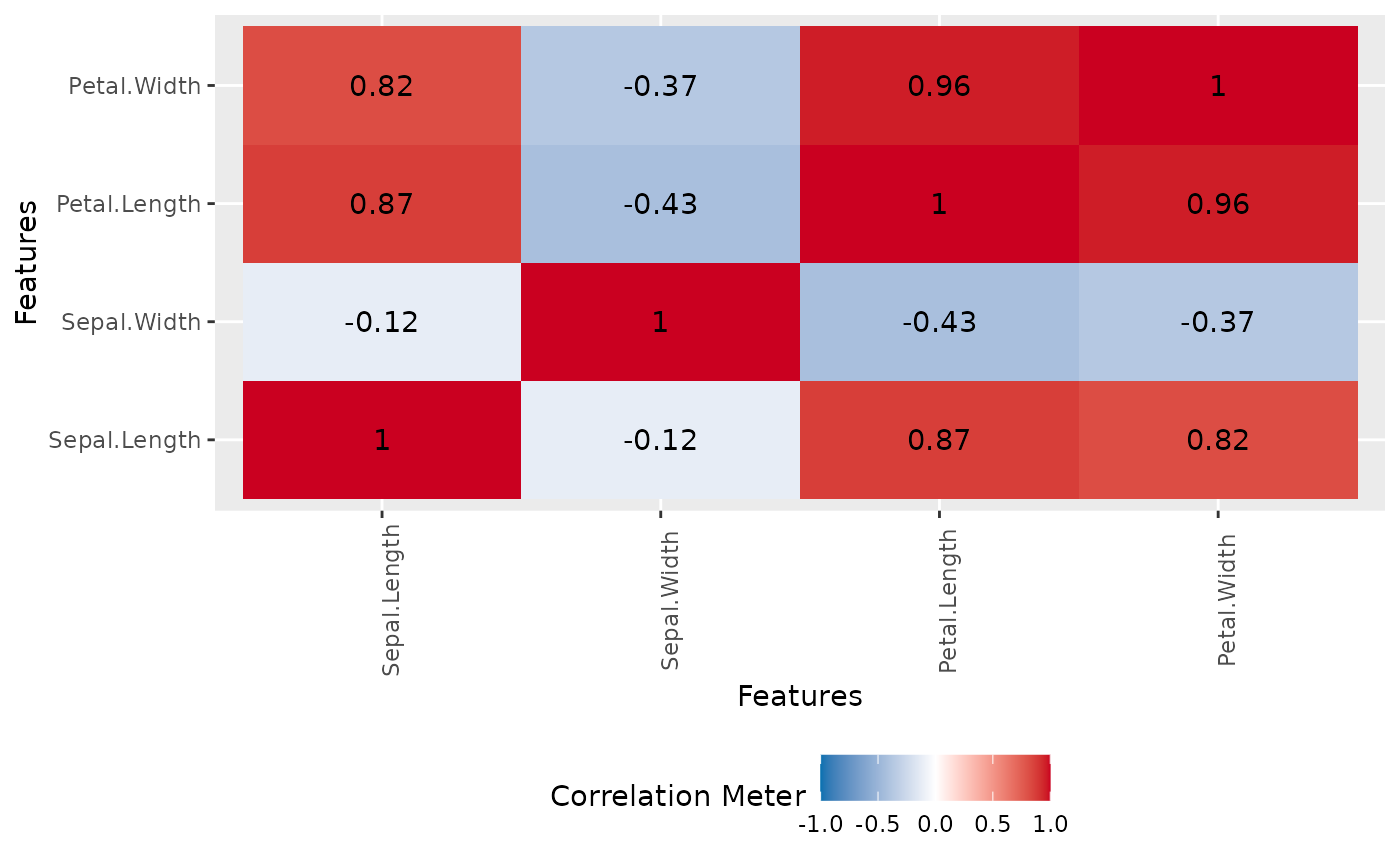
 plot_correlation(iris, type = "c")
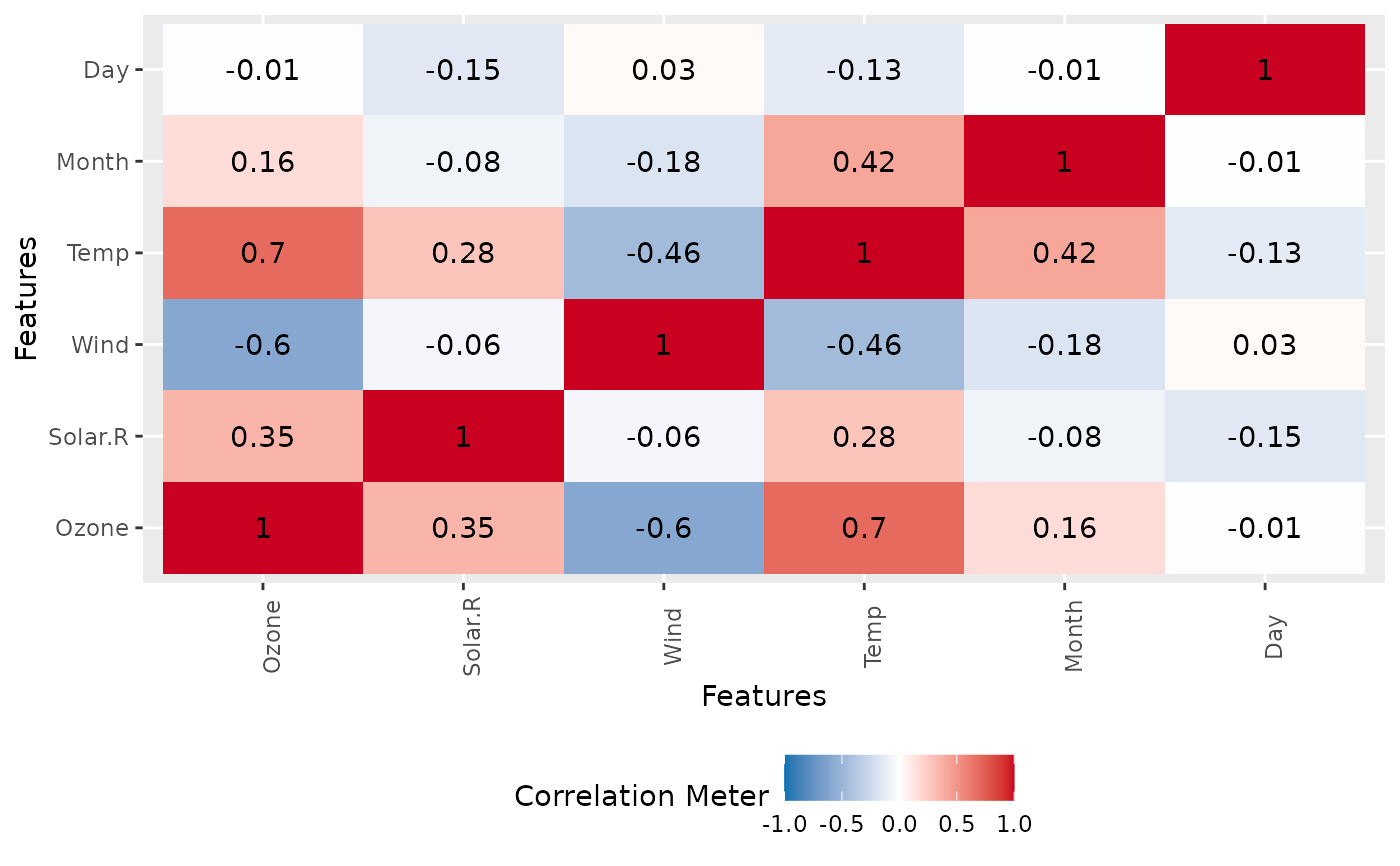
 plot_correlation(airquality, cor_args = list("use" = "pairwise.complete.obs"))